![]()
Education by the Numbers Column by Jill Barshay in The Hechinger Report | http://bit.ly/17cn9qG
February 2, 2015 :: Despite occasional taxpayer revolts, the United States has a history of spending more and more each year on public education. From 1996 to 2008, spending per student, on average, steadily climbed at least 1 percent a year, after adjusting for inflation, according to the National Center for Education Statistics (NCES). But newer data is showing that this seemingly inexorable upward climb hit a plateau with the 2008 recession, and then began declining in 2010.
The most recent data, from the 2011-12 school year, released by NCES on Jan. 29, 2015, show that average per-pupil spending fell 2.8 percent, to $10,667, from the previous school year. That’s the second year in a row that per-student spending fell. In the previous year, 2010-11, per-pupil spending fell 1.6 percent from a year earlier — the first time that spending growth reversed and began declining. (These annual spending figures don’t include capital expenditures on buildings and renovations, which can spike from year to year.)

Visit Original Story to use interactive map: (Use arrows to navigate and click on any state to see student spending data. Interactive map created by Jill Barshay of The Hechinger Report. Source data: Revenues and Expenditures for Public Elementary and Secondary Education: School Year 2011-12, NCES)
This $10,667 is an average figure that includes all public elementary, middle and high schools across the country. Some places, such as Washington, D.C., New York City and Boston, spent more than $19,000 per student in 2011-12. By contrast, average per-student spending in the state of Utah was just $6,441. The figures aren’t adjusted for cost-of-living differences. So you’d expect higher costs in pricier cities.
Not all states saw a decline in spending. Vermont boosted its education spending per student by 10 percent in 2011-12 from 2010-11. Both Delaware and New Jersey raised their spending per student, too. Among the 37 states that saw at least a 1 percent decline in spending, the steepest drops were in Arizona, Florida, Texas, Wisconsin and Washington, D.C.
The new reports (which can be found here and here) offer some clues as to why education spending is decreasing. One major reason is that federal funding to schools fell by more than 20 percent, or nearly $17 billion. That’s because schools had been big beneficiaries of federal stimulus funds to revive the economy after the 2008 recession, but by 2011, those funds had been exhausted. Local and state funding also fell by 0.6 percent and 1.2 percent, respectively. (Federal funds for low-income students, known as Title I funding, were stable).

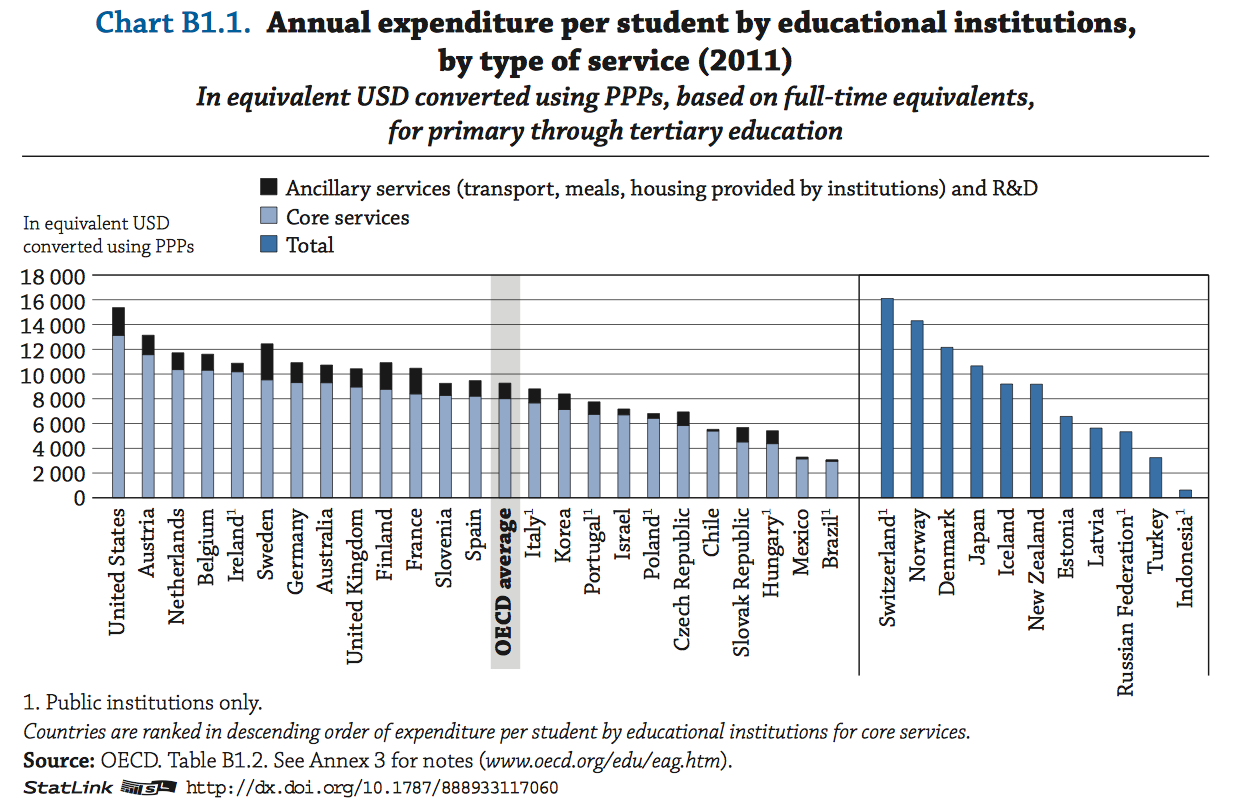
How the drop in spending is affecting the quality of education is an open question. According to data from the Organization for Economic Cooperation and Development, there isn’t a correlation between how much a society spends on education and the performance of its school system. The United States has long been a top spender in these international rankings, but never a top academic performer.
On the other hand, the United States has a higher percentage of children in poverty than other top performing countries, and many experts say that poor children need more resources to catch up to their wealthier peers. Just last month, the Southern Education Foundation calculated that poverty is increasing so much in the United States that for the first time the majority of public school students qualified for free or reduced price lunch in 2012-13.
It is troubling to see the rise in poverty and a decline in education spending happen at the same time.
Related: Public-school spending dropped for the first time
Related: Per pupil spending by school district in the United States


No comments:
Post a Comment