
…but will CORE exist after ECAA passes?
By John Fensterwald | EdSource | http://bit.ly/1HSZo8T
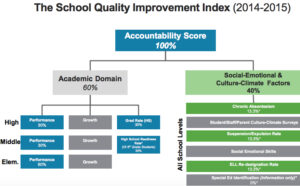
Credit: California Office to Reform Education
Schools in the CORE districts will receive a ranking from 0 to 100 based 60 percent on academic performance, including test scores, graduation rates or, for middle schools, preparation for middle school, and 40 percent based on rates of chronic absenteeism, suspensions and expulsions and English learners who become proficient in English.
Dec 7, 2015 :: The half-dozen California districts in the collaborative known as CORE last week introduced a new index for rating school and student achievement that will include measurements of school climate and culture as well as students’ social skills and attitudes toward learning.
The first scores will be issued when the index is released in February. If allowed to continue after that, the School Quality Improvement System could become an alternative model for school improvement and inter-district collaboration in a new era of federal and state accountability. Or it could end up a one-time experiment that dies with the expected expiration next year of the law that spawned it, the No Child Left Behind Act.
Several years in the making, the CORE index is one of the requirements of the only waiver from the sanctions of NCLB that the U.S. Department of Education granted to school districts. All other waivers were granted to states. The six waiver districts in CORE, the California Office to Reform Education, are some of the state’s largest districts – Los Angeles, Long Beach, Fresno, Santa Ana, San Francisco and Oakland – with a total of nearly 1 million students. But if, as expected, Congress approves and President Barack Obama soon signs a successor to NCLB, the districts’ waiver would end after the current school year, and CORE would then need the approval of the State Board of Education to continue an accountability system that would deviate from the one that the state board is currently developing.
CORE’s leaders hope the index will endure, because they say it will enable teachers and principals to pinpoint areas they need to improve and will allow them to see where other CORE schools with similar demographics are doing better. The index, said Fresno Unified Superintendent Michael Hanson, president of CORE, “will let us identify schools that are beating the odds and learn from them.”
When the index is officially released, all schools will receive a composite number of performance from 0 to 100. In that respect, it will be like the now-suspended state Academic Performance Index, a three-digit number calculated primarily from English language arts and math standardized test scores. But the CORE index will give a more complete, cohesive picture of the qualities of a school than the API. It will factor in results of the most recent tests on the Common Core math and English language arts standards. But other prominent elements will include rates of designating English learners proficient in English, high school graduation rates and an indicator of how well middle schools have prepared 8th graders for high school that looks at student suspension rates, attendance and grades.
The state’s new financing law, the Local Control Funding Formula, also requires that the state take a multi-dimensional approach to school accountability, laying out eight priorities, including parent and student engagement and school climate, that districts must measure and address. The state board, in its early drafts of an accountability matrix, is heading in roughly the direction that CORE has taken. But CORE, working with the John Gardner Center for Youth at Stanford University, is collecting data on a few key student indicators, like chronic absenteeism, that the California Department of Education’s student data system doesn’t compile. It also takes a more fine-grained look at disparities among racial and ethnic subgroups, by defining a subgroup as 20 or more students in a school, instead of the state’s minimum of 100.
Criticism of mindset metrics
The big distinction is CORE’s work in non-academic areas – what CORE is calling the social and emotional/school culture and climate indicators, which will make up 40 percent of a school’s score. Although the results won’t be included in the first year’s index, CORE conducted school climate surveys and additionally piloted questionnaires asking students to rate themselves on how hard they work and how they deal with challenges. It asked teachers to rate students on the same school culture and personal learning factors. For this year, that portion of the index will be limited to measures of chronic absenteeism; suspensions and expulsions; and English learners’ progression to fluency.
The index reflects the recognition among school leaders that students’ social skills, like collaboration and confidence in their ability to learn, are, along with subject knowledge, an important part of preparing students for college and careers. CORE based the questions on the pioneering work of University of Pennsylvania professor Angela Duckworth and worked with the Harvard Center for Education Policy Research.
But CORE’s work in this area is as controversial as it is cutting-edge. Experts like Stanford professor Carol Dweck and her associates at the Project for Education Research That Scales, or PERTS, are discouraging school districts from using student and teacher surveys on learning mindsets as part of an accountability system because they’re too subjective – two students’ perceptions of hard work can be very different – and subject to adult influence.
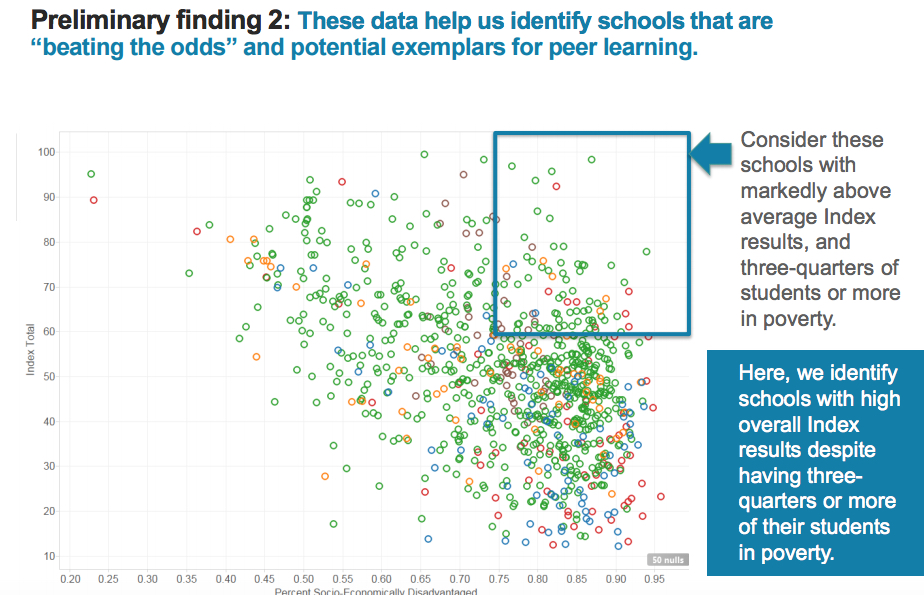
Credit: California Office to Reform Education
The School Quality Improvement Index will allow comparisons among schools in the CORE districts. On this scatterplot, a school’s percentage of low-income students is the horizontal axis, and performance on the index is the vertical axis. The upper right area shows high-poverty, high-achieving schools. The schools will be identified when results are released in February.
Rick Miller, the executive director of CORE and a former deputy state superintendent of education, said, “We know about and share these concerns. We don’t know if surveys will prove to be the right tool, but it’s the best we have now, and the social-emotional piece is worth paying attention to.” The goal will be to incorporate more objective measures: direct observations of students and student performance on game-based assessments or complex performance tasks, he said.
Noah Bookman, CORE’s chief accountability officer, said that the initial results showed there is a correlation between academic performance and the non-cognitive factors. The lowest academic performers also had the lowest social and emotional scores, while the opposite was true with high-achieving schools.
Having suspended the API, the state board has made clear it doesn’t want to re-create it. That position may put it at odds with CORE’s 1-to-100-point index. State board President Michael Kirst said a data dashboard, highlighting multiple performance measures, provides a more complex, instructive look at a school than a single number conveys.
But Miller said the NCLB waiver required a single school number as a transparent way to identify the worst-performing 5 percent of schools, and the state may have to create the same kind of index if the Every Student Succeeds Act, NCLB’s successor law, is adopted.
“I agree that the single index has a limited value,” he said during a presentation to other superintendents in San Diego on Friday, “but the measures of all of the individual elements are powerful. Knowing how your school’s suspension and expulsion rate compares with everyone else in the network can help you improve.”
He said that some districts that weren’t part of CORE and the two that dropped out of the waiver – Sacramento City and Garden Grove – have indicated they want to share their data and use the index.


No comments:
Post a Comment